EOL | Labor AnalyticsLabor, Technology & a Changing Economy
Menu
Independent labor-market research · September 2026

Evaluating the Changing Demand for Human Labor

EOL Labor Analytics evaluates how AI, robotics, and automation move from technological capability to real labor-market effects across occupations, then translates that evidence into working outlooks for 2030 and 2035.

The first EOL assessment follows 20 occupations through a common analytical framework.

The objective is not a single automation score. It is a transparent view of technological progress, changing dependence on human labor, labor-market evidence, and the conditions that would alter the forecast.

20Occupations
6Transition stages
2030 / 2035Working outlooks
The EOL framework

Exposure is the beginning of the analysis, not the conclusion.

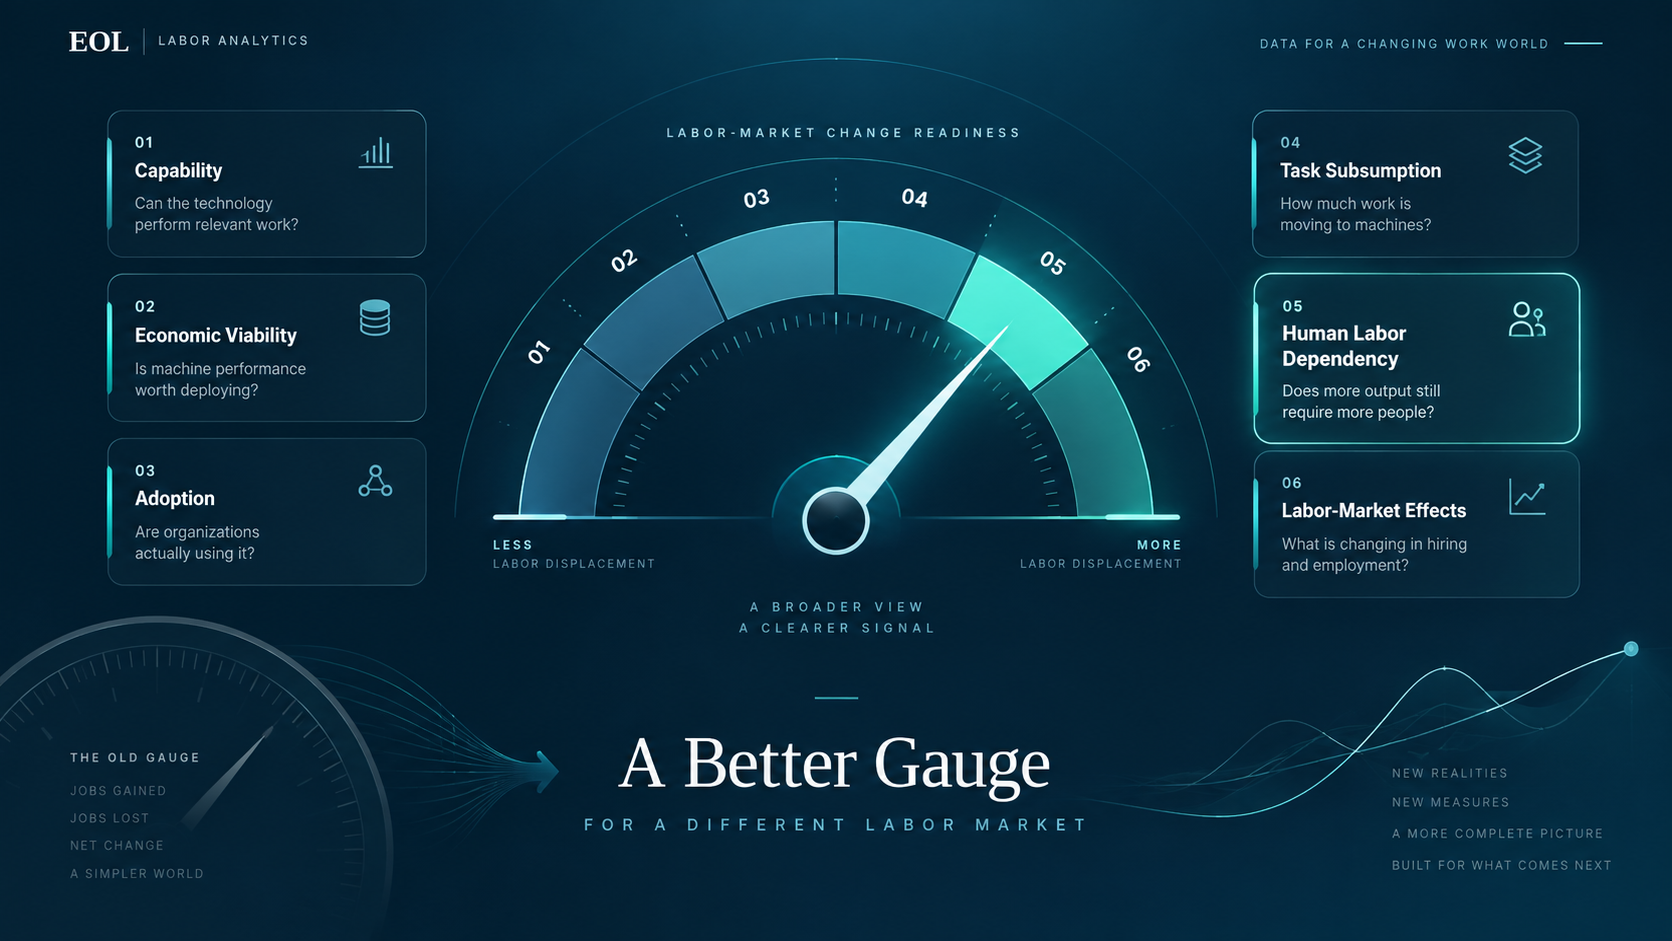
EOL follows the path from what technology can do today to whether technological change is actually appearing in hiring, staffing, wages, hours, and employment.

01 · Capability

Can the technology perform relevant work?

Current capability in the occupational environment, not a hypothetical future system.

02 · Economic Viability

Does substitution or augmentation make economic sense?

Cost, performance, workflow design, and the economics of deployment.

03 · Adoption

Are capable systems actually being deployed?

Commercial adoption rather than demonstrations, pilots, or technical possibility alone.

04 · Task Subsumption

How much of the task bundle is moving to technology?

Workflow-level substitution can matter even when no single system performs the entire occupation.

05 · Human Labor Dependency

Does more output still require more human labor?

The central structural question is whether output can scale increasingly through machine capacity.

06 · Labor-Market Effects

Are upstream changes becoming visible in the labor market?

Hiring, hours, staffing ratios, wages, occupational entry, and employment provide the downstream test.

The stages are assessed separately. EOL does not mechanically combine them into an automation score.

Explore the methodology →
September 2026 assessment

The outlook varies sharply across occupations.

The chart shows EOL working ranges relative to the 2025 employment baseline. Switch between the 2030 and 2035 horizons. BLS structural projections appear as gold markers in the 2035 view.

EOL rangeBLS 2035
Occupation
−20%0%+20%
EOL working range
O0115-1252
Software Developers Strong evidence tilt toward displacement
-2% to +3% -16% to +2% BLS +10.2%
O0213-2011
Accountants & Auditors Moderate evidence tilt toward displacement
-1% to +3% -7% to +3% BLS +5.0%
O0323-1011
Lawyers Moderate evidence tilt toward displacement
-1% to +3% -7% to +3% BLS +4.7%
O0443-4051
Customer Service Representatives Strong evidence tilt toward displacement
-5% to -2% -12% to -5% BLS −5.3%
O0541-3091
Sales Representatives of Services Strong evidence tilt toward displacement
-1% to +2% -8% to +2% BLS +2.7%
O0627-1024
Graphic Designers Strong evidence tilt toward displacement
-4% to 0% -12% to -3% BLS −1.7%
O0725-2031
Secondary School Teachers Balanced evidence
-1% to +2% -3% to +2% BLS −0.2%
O0817-2141
Mechanical Engineers Balanced evidence
+3% to +6% +4% to +9% BLS +11.2%
O0929-1215
Family Medicine Physicians Balanced evidence
+1% to +4% +2% to +6% BLS +3.3%
O1043-6014
Secretaries & Administrative Assistants Strong evidence tilt toward displacement
-5% to -2% -12% to -6% BLS −6.0%
O1137-2012
Maids & Housekeeping Cleaners Moderate evidence tilt toward displacement
-1% to +2% -10% to 0% BLS +0.6%
O1253-7062
Freight/Stock/Material Movers, Hand Strong evidence tilt toward displacement
-4% to 0% -13% to -3% BLS +1.8%
O1353-7063
Machine Feeders and Offbearers Strong evidence tilt toward displacement
-7% to -3% -16% to -11% BLS −13.1%
O1453-3032
Heavy & Tractor-Trailer Truck Drivers Strong evidence tilt toward displacement
-2% to +2% -14% to -3% BLS +3.8%
O1547-2061
Construction Laborers Balanced evidence
+3% to +6% +3% to +8% BLS +7.3%
O1635-3031
Waiters & Waitresses Moderate evidence tilt toward displacement
-2% to +1% -8% to 0% BLS +2.0%
O1735-3023
Fast Food and Counter Workers Strong evidence tilt toward displacement
-1% to +3% -12% to 0% BLS +5.8%
O1829-1141
Registered Nurses Balanced evidence
+3% to +6% +4% to +9% BLS +5.6%
O1931-1120
Home Health & Personal Care Aides Moderate evidence tilt toward displacement
+6% to +11% -5% to +10% BLS +18.1%
O2033-3051
Police & Sheriff’s Patrol Officers Moderate evidence tilt toward displacement
0% to +3% -3% to +3% BLS +3.5%
Forecast discipline

Why EOL develops its own forecasts alongside BLS

BLS remains the structural reference for every occupation EOL assesses.

Extending the sight picture when historical relationships are changing

BLS occupational forecasts are indispensable, but forecasts grounded in historical relationships are less reliable when those relationships are being disrupted. EOL Labor Analytics is built for that problem, using a new analytical framework to extend the sight picture of how AI and robotics may change the demand for human labor over the coming decade.

Read why EOL develops its own forecasts alongside BLS →

External probabilistic forecasts are also shown when a defensible occupation match exists. They are reference points, not ingredients mechanically averaged into the EOL range.

Structural reference
BLS

Official 2025–35 occupational projections and underlying demand structure.

Independent calibration
Metaculus

Probabilistic forecasts where EOL can establish a sufficiently strong occupational match.

EOL working outlook
EOL

Working ranges formed from the six-stage transition evidence, underlying demand, and observed labor-market effects.

Labor supply is a separate layer.

EOL also evaluates the worker pipeline feeding each occupation. Supply does not replace the demand forecast; it helps show whether future entrant flows are likely to reinforce, cushion, or conflict with the expected demand trajectory.

How EOL analyzes supply →
Companion publication

The End of Labor and the Last Worker

Long-form analysis of the broader economic, institutional, and social implications of the AI and robotics transition accompanies the occupation-level research published here.

Questions, corrections, or comments on the analysis? The best way to reach EOL Labor Analytics is through our Substack, The End of Labor and the Last Worker.

Read the publication ↗